.jpg)
.jpg)
Essential Strategies for Balancing Work and Life in Construction
Editorial Note: This article was brought to you courtesy of Rose Morrison, managing editor of ...


Construction isn’t simply a matter of putting the correct materials together in the proper order. Before even the first nail can be driven home, you need to have a clear-eyed understanding of the land you’re building on. This understanding ought to be informed not only by the precise lines and boundaries drawn up by prudent surveyors, but also by the richness of history and nuances of place that any spot on the map is imbued with. Just as every gram of soil teems with billions of microscopic lifeforms, so too does every cross-section of geography contain a staggering multitude of stories and information about the terrain itself and those who call it home. How can all of this data be accessed? How can a deeper sense of place be used to inform the built environment within the larger context of the natural one?
As it often does for questions of this sort, technology has provided an answer. That answer takes the form of three letters that you’ve probably heard by now, but perhaps don’t yet have the firmest understanding of: GIS. This article will explain what exactly GIS is, give a brief account of its history, discuss some of its applications in the world of construction, and take a shot at spying what the future holds for this peculiar little acronym.
GIS stands for Geographic Information System. It’s basically what you get when you combine a map with a computerized database. A typical GIS interface is an explorable sandbox, a digital map of an area containing multiple layers of spatial and non-spatial data about the built and natural environments. This framework, composed of specialized sets of software tools, allows users to examine and analyze patterns between both graphical and non-graphical datasets with a level of precision and clarity that would be difficult to achieve in any other format.
In short, GIS is a way to visualize data that’s tied to a place.
Literally any piece of information that can be pinned to a location on a map—be it in the form of an address, parcel number, or geographical coordinates—can be incorporated into a GIS interface. Maybe you’re looking for insight into the socioeconomic background of a particular neighborhood. Or maybe you’re hoping to study an area’s ecosystems before breaking ground on a new highway project. Perhaps you’re looking to predict where future natural disasters will strike based on past weather patterns.
Above image: A map of London created by Dr. John Snow in 1854. The black spots on the map represent cholera-related deaths. (Source: National Geographic)
GIS can be used for all of these things and much more. Similar to how GoogleMaps offers separate versions of the same map, with street and terrain views that can be toggled on and off (or how in One-Key you can toggle between these features when inspecting tool and equipment historical data), GIS applications provide an array of filters that can be added, subtracted, or stacked atop one another to provide a variety of perspectives on the vista in question. The automatic, multifaceted, and highly versatile nature of GIS is what makes it such a valuable asset for those who use it, which includes everyone from the government to industrial, business, nonprofit, academic, and scientific professionals. Everything from public health to urban planning can be enhanced with GIS. As a place-based research tool, few are as powerful or as widely applicable.
The practice of combining maps with data is often credited to Dr. John Snow, a physician who, in the summer of 1854, successfully traced the origins of a massive cholera outbreak in London to a single infected water pump on Broad Street. His famous cholera map (you can even explore a GIS version of it) is widely cited among industry and academic circles as the earliest forerunner to the GIS maps of the modern era. This isn’t entirely true, however. While intriguing and foundational to the discipline of cartography, the story surrounding Snow’s map is a bit more complicated than what meets the eye. Namely, most accounts of GIS history place great emphasis on the influence of Snow’s map but leave out the fact that there exist even earlier examples of data-heavy maps similar to those later generated by GIS software, including the one pictured below from 1798 of a yellow fever outbreak in New York.
However, it wasn't until the 1960s that the history of GIS began in earnest. Before this period, the most sophisticated data-oriented maps required the layering and annotation of multiple sheets of paper or transparencies arrayed atop light tables. The results were limited and cumbersome, their production time consuming and inefficient.
Enter Roger Tomlinson. At the time a young geographer, Tomlinson was hired in the early 60s to create a novel new way to map the vast natural terrain of the Canadian countryside. The developers of the project wanted to be able to ask questions of the map and filter for specific sets of data. By turning to computers, Tomlinson was able to create the world’s first fully functional Geographic Information System, which is why he is hailed to this day as the “father of GIS.”
Pictured: Roger Tomlinson, the "Father of GIS." Source: Wiki Commons
It was also Tomlinson who, in a 1967 paper on the subject, coined the term “geo-information system,” which was later paraphrased as “GIS.”
It’s worth pausing here to note that the seamlessness with which large complex datasets are merged into interactive digital maps requires a level of sophistication beyond the ability of any one person, no matter how brilliant or prescient. That is to say, GIS is a team sport. To operate smoothly, GIS maps above all else call for a tremendous level of collaboration across many fields of expertise. The same held true for its development. Tomlinson got the ball rolling but as with all technologies, there were many others—more than can be named here—who made significant contributions to the growth of GIS in its early days.
Back to the timeline. The next big development came in the 1970s, when the Environmental Systems Research Institute (ESRI) began usings its own in-house GIS interface to provide land based consultations for development projects. There were other companies perfecting their own GIS tools at the time but it was ESRI that unveiled the world’s first commercially available GIS system in 1982. Suddenly, governments and businesses had the ability to create GIS projects of their own. The original ARC/INFO and a later iteration of ESRI’s GIS software called ArcGIS are still in wide use to this day.
Image Source: Wiki Commons
As computer processing power advanced at a rapid clip, so too did the capabilities of GIS. One of the most noteworthy benchmarks came with the arrival of another three-letter acronym related to geography: GPS. Developed by the US military through the 60s and 70s and made widely available in the 90s, the satellite technology of the Global Positioning System made it possible to more accurately pinpoint locations within GIS maps to their precise locations on the Earth’s surface. GIS has continued to benefit from and keep pace with improvements to technology into the present day, where any citizen can now easily peruse a variety of cloud-based GIS platforms from the comfort of their home computer or mobile device.
Once the sole domain of specialists and technical wizards, the wonders of GIS are now free to explore by anyone with access to a computer connected to the internet. GoogleMaps and GoogleEarth are two of the most obvious, ubiquitous, and user friendly examples, but there are many other online GIS resources currently available for use by the public.
Let’s take a look at the common GIS examples existing today. These 5 GIS platforms are free for you to start playing around with today.
An excellent place to begin your GIS journey is to search for your home address on your city or county website. More specifically, many municipal and county governments keep extensive property records on their own designated GIS applications that can be freely accessed by the public.
Using these local systems, you can learn about precise property boundaries and dimensions of living spaces, as well as detailed histories of ownership and timelines of additions, including, say, what exact year your backyard patio with the busted rail was built. This baseline of features can be incredibly useful for research during the homebuying process, though other features may also be included that add even more value to what is, again, a completely free online tool. Our hometown of Milwaukee, for example, has a variety of county based GIS applications that can be used to research everything from historical city maps to elected officials by district. If you’re having a hard time finding your community’s system, just type “GIS” plus the name of your county or city into a search engine of your preference and see what pops up.
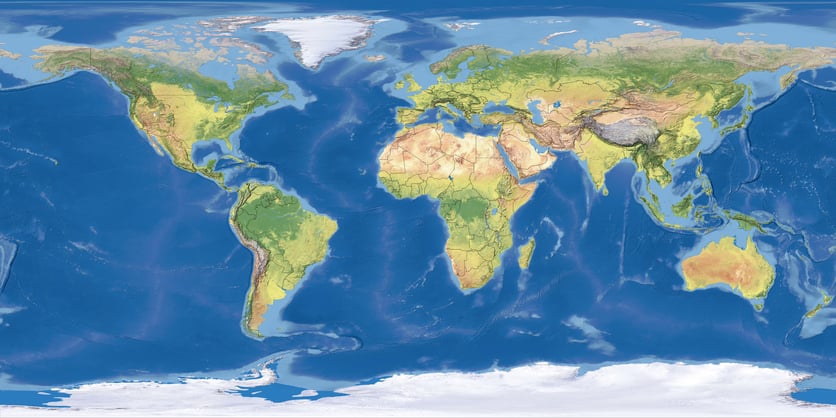
Looking to make your own map but don’t know where to start? Well, look no further. Natural Earth Data is a public domain GIS resource created by volunteers who have put together an essential toolkit for cartographers aiming to build their own custom maps. With its tools, users can create detailed maps of terrain populated with multiple layers of data, including everything from cultural boundaries and topography to the contours of the ocean floor and more. Like all the other resources listed here, Natural Earth Data is completely free to use.
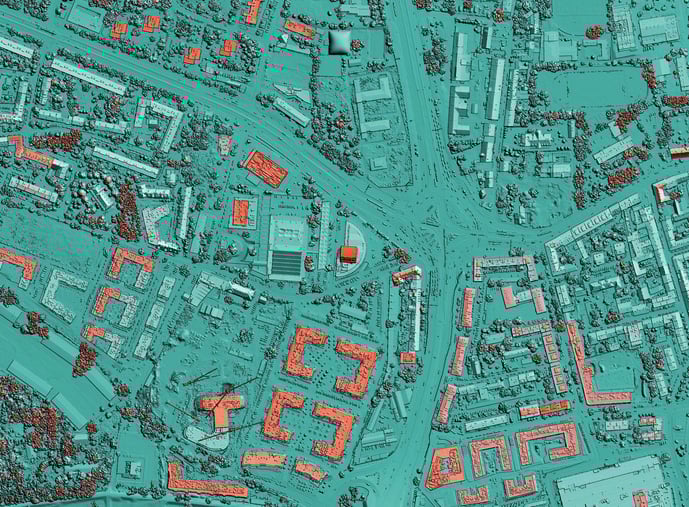
The San Diego based group behind Open Topography created their free GIS platform for the express purpose of democratizing access to high-resolution topographic and bathymetric datasets.
Image Source: Wiki Commons
One of the main things that makes Open Topography such a valuable resource is that it houses a wealth of LiDAR, or Light Detection and Ranging data. LiDAR uses rapid laser scans to capture highly accurate 3D representations or “point clouds” of a given geography. Suffice to say that not everyone has access to the wealth and technology necessary to generate these kinds of maps, so making such a broad range of LiDAR data available for the low price of absolutely free is no small matter. Most of the datasets on Open Topography are currently concentrated in the continental United States, particularly on the West Coast, though some clusters are mapped in other areas of the globe as well.
When it comes to curating a vast array of GIS content, few tools are as comprehensive as ESRI’s ArcGIS data hub. Thousands of cities, businesses, universities, and nonprofit organizations rely on this online platform to store and display their very own GIS applications, which are deployed for a variety of purposes. The United Nations, for instance, utilizes ArcGIS for a number of location based initiatives, including a list of 17 sustainable development goals put together in 2018 as a response to climate change. Meanwhile, the city of Los Angeles has enlisted ESRI’s software in a public health campaign against diabetes. Speaking of public health, many other cities have also leaned heavily on the ArcGIS data hub as a tool for visualizing COVID-19 numbers. Groups looking to create their own GIS applications within the hub must pay a subscription fee but most of the resultant resources can be viewed freely by the public. Feel free to browse some of those resources if you're interested.
Climate change is dramatically altering our planet in ways that are often disturbing and difficult to comprehend. For those looking to go beyond the written accounts of scientific experts, GIS tools like the NASA Earth Observatory (NEO) allow you to more directly observe how our interconnected environments are changing from one day to the next. Explore global atmospheric conditions like rainfall patterns and aerosol thickness, or peer into other spectrums entirely, with windows that reveal average land surface temperatures or the amount of solar radiation bathing the planet at a specific moment in time. Though once contested, the stark reality of human caused climate change is now widely accepted. Figuring out what to do about the problem may seem like an insurmountable task, but tools like NEO can empower users to more deeply understand the situation and take the first step, whatever that might look like.

In an industry as massive and far-reaching as construction, it’s easy to slip into abstract thinking and forget that every building project takes place on an actual piece of land. Before it is uttered by any real-estate agent, the tired old maxim “location, location, location” must first guide the construction process. When it comes to what gets built when and where, the terrain itself has the last word. What is the elevation and soil quality of the proposed job site? How prone is the region to droughts or flooding? Is there a history of chemical spills or any other toxins to consider? What kinds of utilities and amenities are available in this neighborhood? Is public transportation within reach? How will a district's property values affect the future of a particular development and vice versa? Where are the property lines? What codes are enforced? You can’t plan, let alone start building, without first asking these basic questions tied to the physical land. And odds are the answers are stored in a GIS application like the ones described above. Using GIS, architects, engineers, and project managers, who are mindful of sustainability, can make more informed decisions about how their projects can be designed to make less destructive impacts on surrounding ecosystems. Computerized geospatial tools also allow surveyors to quickly and accurately define the footprint of a jobsite, which can then be plugged into Building Information Modeling (BIM) software to serve as a solid virtual foundation for a project during the planning and execution phase.

Precision and orientation are key to construction work and nothing points the way more precisely than a good old map. Having a clear understanding of and competency with the galaxy of GIS tools available can make life much easier for those navigating the spaces where the rubber meets the road.
As it has in the past, the future of GIS will almost certainly continue to align with advances in computers and other geospatial platforms. The combination of GIS and BIM, for instance, has the potential to transform both technologies for the better, a prospect that has exciting implications for the next frontier in virtual planning: City Information Modeling (CIM). As long as there are buildings, there will be a need for us to understand how they fit into the spaces that surround them. Part of the reason why we find ourselves in the midst of a global climate crisis is that we’ve historically built things without much care for how they affect the bigger picture. Our built environments exist within and have a serious impact on the larger context of the natural world around us. How individual buildings, neighborhoods, cities, and regions relate to each other and the ecosystems they are contained within ought to be kept at the forefronts of our minds as we endeavor to build a more sustainable future. We have many tools to help guide us along the way. GIS is one of them. What better way to understand our complicated and rapidly changing world than by taking a deep dive into an interactive map bursting with layers of vital data about everything from sea level rises to the people we share our communities with?

Sign up to receive ONE-KEY™ news and updates.
Editorial Note: This article was brought to you courtesy of Rose Morrison, managing editor of ...
Editorial Note: This article was brought to you courtesy of Rose Morrison, managing editor of ...
Editorial Note: This article was brought to you courtesy of Rose Morrison, managing editor of ...